Make your research data stand out! Learn how to create elegant data visualization graphics in R using the ggplot2 package.
Intro to Data Visualization with Ggplot2 in R
Intro to Data Visualization with Ggplot2 in R
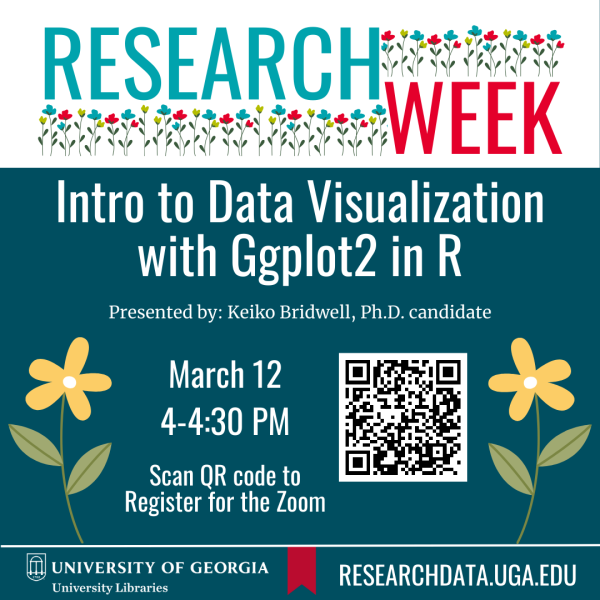
| 04:00 pm - 04:30 pm | Online
Event Contact Name
Dr. Katherine Ireland
Event Contact Phone
(706) 542-5998
Event Contact Email
digi@uga.edu
Event Website
Event Types
Classes and Workshops